Are you wondering whether your camera lens is good enough? Do you know what resolution is? It doesn’t matter whether you have a smartphone camera, an analog or a digital system camera. The method of testing lenses presented here is easy to perform, accurate, and always works.
Page Contents
The eye of photography
The lens is comparable to the human eye and collects the incident light in order to focus it on the image sensor (or the film). Different designs for lens arrangements and coatings lead to different imaging properties such as sharpness, contrast and color rendition.
Why I test
Recently I wanted to compare the performance of two historical Minox lenses. I was interested in whether the Complan is really better than the Minostigmat. There is no information on this, so I wanted to find out for myself. And I learned that testing lenses isn’t that difficult. Unfortunately, there weren’t any instructions that suited me, so I wrote some to share my experiences.
Testing the resolution of lenses is possible at home with simple means if you know how to do it. You can find many lens reviews on the internet, but hardly any concrete instructions that you can actually implement. It took me a while to figure it out and I would now like to share it here.
What I am testing
My text starts with a brief introduction to the two test charts I use. If you are only interested in the practical procedure, you can skip this and go straight to the application.
Lenses are assessed according to various criteria, for example chromatic aberration, coma and astigmatism, distortion as well as sharpness and resolution. Here I want to describe how I test the resolution of my lenses.
The sharpness of an image is a complex concept that cannot be easily measured. Although it depends on various factors, the overall image is more than the sum of its parts. Nevertheless, we need to take a closer look at some of these factors in order to assess image quality. Resolution indicates how finely detailed an image can be. A high value does not automatically mean a sharp image. Other factors such as contrast are also decisive.
Contrast is the key to sharpness. It determines how clearly light and dark areas stand out from each other. A high contrast of detail, especially in fine structures, makes an image appear sharp.
What testing methods are there?
Sharpness is a combination of various factors, of which contrast plays a decisive role. While the resolution determines the maximum level of detail, the contrast ensures that these details are visible.
The resolution of photographic lenses is typically measured using various methods that assess the lens’ ability to render fine details in an image. Here are some common approaches to measuring resolution:
Test Charts: Photographers often use test charts to assess sharpness and resolution. Well-known examples include the “Siemens star” diagram or the “USAF 1951” test chart. These charts contain fine lines and patterns, and their visibility indicates how well the lens can resolve details.
Resolution Measurements in Line Pairs per Millimeter (LP/mm): In this method, the maximum number of line pairs that a lens can resolve at a specific distance and aperture is counted. Higher values indicate better resolution.
Practical Tests: Photographers can also conduct practical tests by taking pictures of fine details under controlled conditions and then enlarging them to assess sharpness and detail.
My testing method

I consider lens tests that take the whole system into account to be particularly suitable. With analog cameras, this consists of lens, camera body and film; with digital cameras, of course, without film.
For testing lenses, I photograph test charts with Siemens star and USAF 1951 patterns. These are very suitable and proven to determine line pairs per mm. To be able to compare different sizes of negatives or sensors, I calculate the lines per negative height or sensor height. To be able to better visualize the result, I also determine how much the image could be enlarged so that the human eye can still distinguish the line pairs.
With analogue cameras, I digitize the negative before evaluation. Of course, I have to make sure that no relevant information is lost during digitization. The resolution when digitizing must therefore be significantly better than the expected resolution on the film.
My test setup
For a better understanding of resolution in photography, you can find a simple explanation here.
Siemens star test chart
A Siemens star is a radial pattern of lines that converge at a central point. As the lines get closer together towards the center, they form a star-like shape. When imaged, a perfect lens will reproduce these lines clearly and sharply right up to the center. Any aberrations or diffraction in the lens will cause the lines to blur or merge together prematurely, revealing the lens’s resolution limits.
You can generate a Siemens star on this website or use this one (with 48 rays).
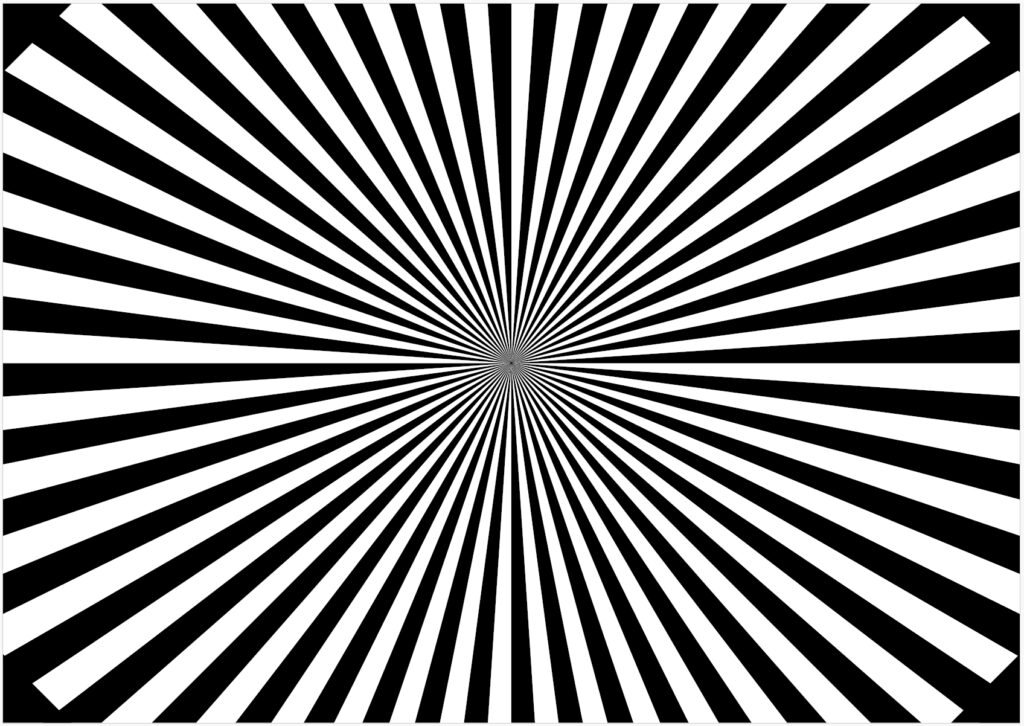
The star pattern makes it easy to visually assess the sharpness and contrast of an image, even without sophisticated measurement tools. Zoom into the area of the image where the lines of the star are just recognizable as individual lines and do not merge. Determine the distance of this area from the center of the star in millimeters:
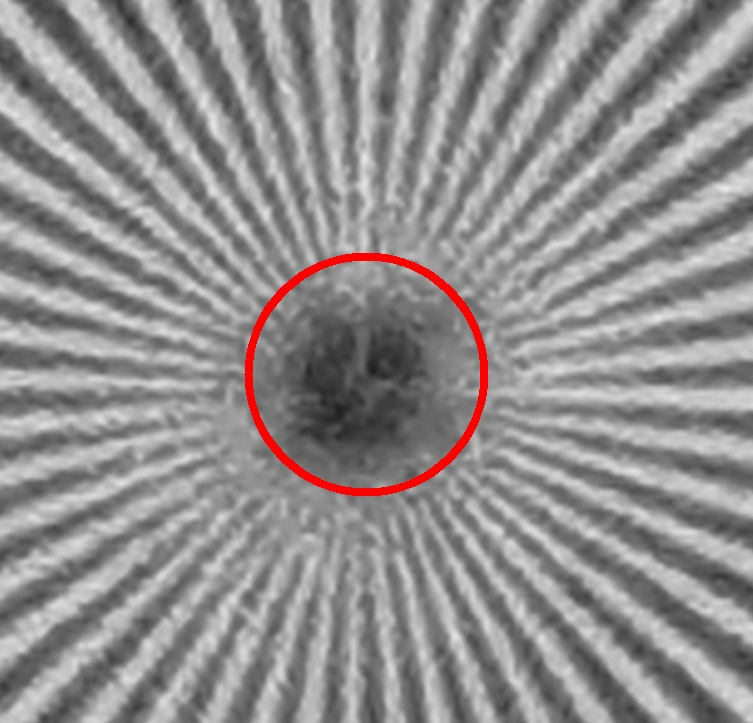
(Minox A IIIs / Adox CMS 20)
Calculate the spatial frequency using the following formula:
resolution in LP/mm = number of rays / (2 * radius * π)
Example:
A Siemens star with 48 rays shows the first merging of the lines at a radius of 0.035 mm on the negative (see picture above).
resolution = 48 / (2 * 0.035mm * 3.14) = 218 LP/mm
USAF 1951 test chart
A USAF chart, also known as a 1951 resolution test chart, consists of a series of equally spaced lines of varying widths. Each group of lines has a corresponding resolution value in lines per millimeter (lp/mm). By examining the highest resolution group where the lines are still clearly resolved, the limiting resolution of the lens can be determined. USAF charts provide a numerical value for the lens’s resolution, allowing for more precise comparisons between different lenses. The USAF chart is a widely recognized standard in the optics industry, ensuring consistent results and enabling comparisons across different testing environments.
Printing a USAF 1951 test chart
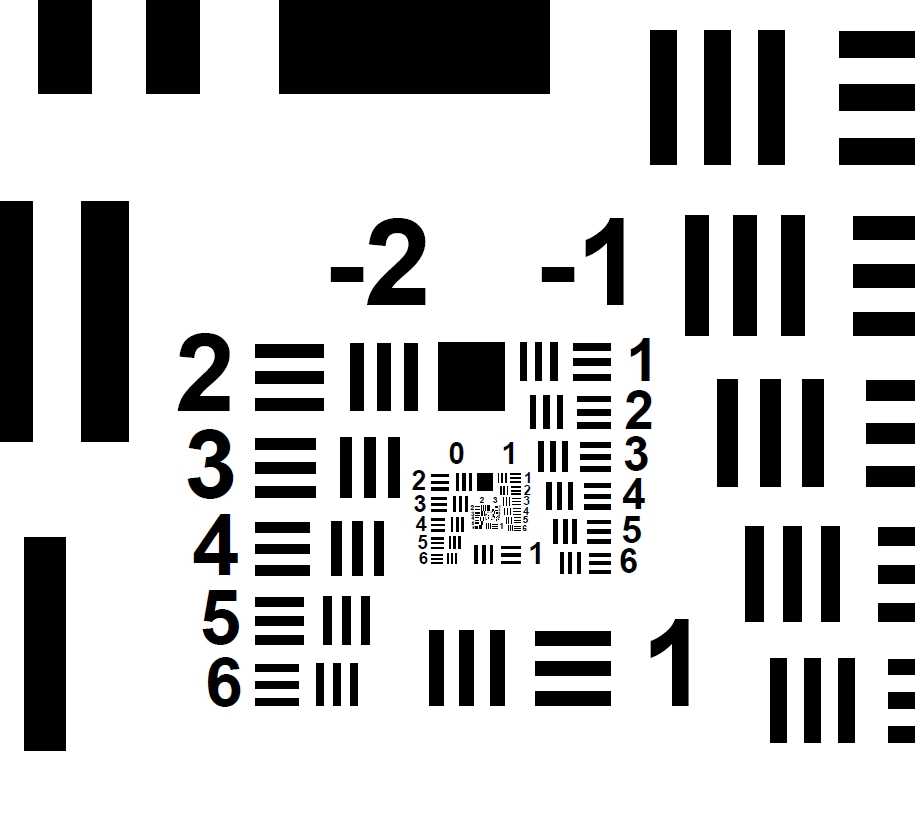
This chart should be printed such that the side of the square between group -2 and -1 should be 10 mm long (i.e. print the pdf of the chart at 114%).
You are looking for the smallest group of lines in which the individual lines can still be clearly separated from each other and do not blur into a continuous grey. Each group and each element in the USAF chart is assigned a specific value in line pairs per millimeter (lp/mm). The value of the last group that can still be resolved indicates the limiting resolution of the system.
Evaluating a USAF 1951 test chart
The resolution in line pairs/mm can be calculated from the group/element combination found using the following formula:
resolution in LP/mm = 2group+(element-1)/6
Or you can read the value directly from this table:
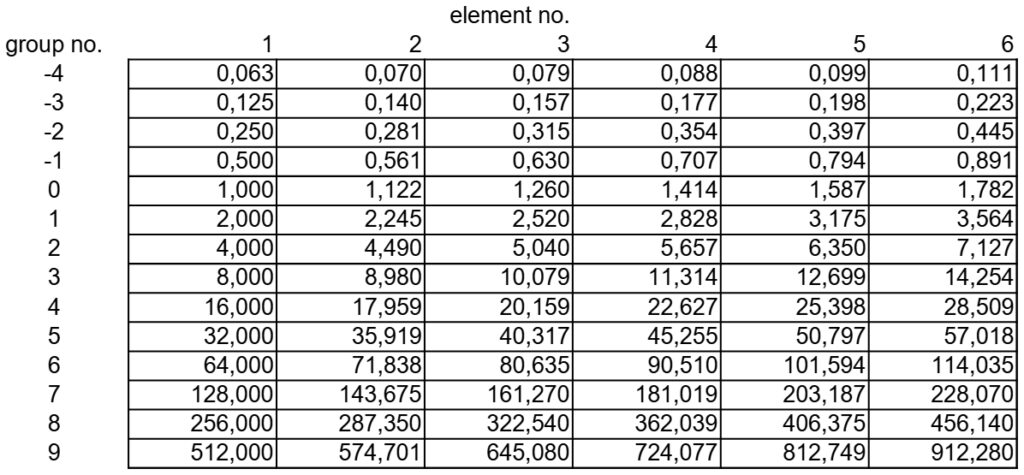
Example: To determine the smallest resolution that I can still see with my eyes, I look at the USAF image above. I change the magnification of the image on my monitor so that the black square in the center has an edge length of 10 mm. Then I look for the group containing the smallest element where I can just distinguish the bars. In my case, this is group 2, element 2. From the table I read a resolution of 4.49 LP/mm for this combination.
I can determine the resolution for a camera/lens/film combination in the same way. To do this,
- I create a paper printout of the USAF chart in the best possible print quality and at a magnification on which the black square in group -2 has an edge length of exactly 10 mm.
- I take a photo of the test chart.
- I look for the smallest element on the negative in which I can still distinguish bars.
- Then I read off the corresponding resolution in LP/mm value in the table.
- I determine the reduction scale between the size of the paper chart and the size of the chart on the negative.
- I multiply this value by the found LP/mm value to obtain the final resolution in LP/mm.
Why does the resolution from step 4 still have to be multiplied by the reduction scale? The resolution in the table or from the formula refers to the size of the test chart. However, the element was determined on the much smaller negative or sensor. The resolution there is therefore as much greater as the negative is smaller than the original chart.
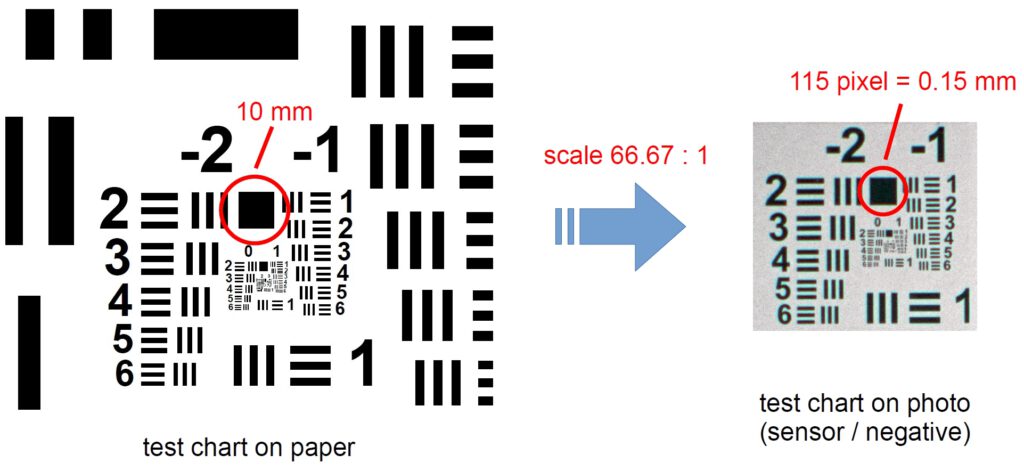
Example of USAF 1951 test chart evaluation
Example:
Determination of the resolution of a Minox A IIIs camera in conjunction with ADOX CMS 20 film:
- I note that the black square on the paper print is 10 mm in size.
- I choose a distance of 1 m and take the photo.
- I look for the smallest element that is still recognizable and get group 1 / element 2.
- For this combination, I read the value 2.245 LP/mm in the table.
- I measure the edge length of the black square on the negative and get 0.15 mm. From this I calculate the reduction from paper to negative with 10 / 0.15 = 66.67
- This gives the resolution of the camera/lens/film combination as 2.245 * 66,67 = 150 LP/mm.
Practical application
Make your own test chart
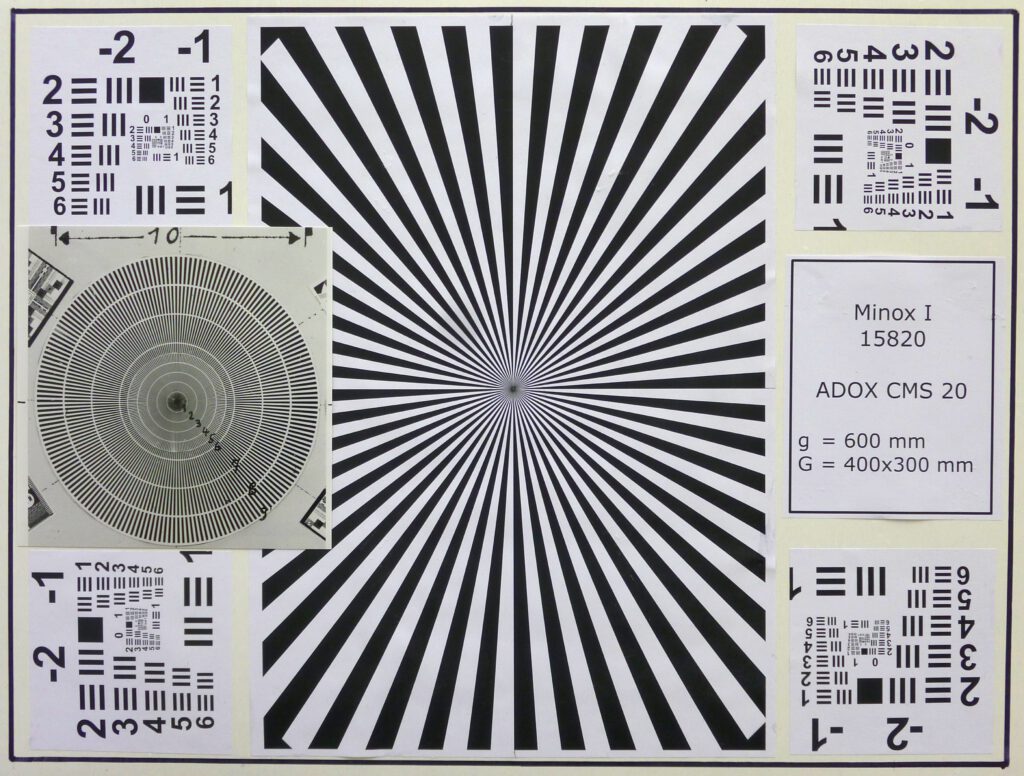
You can print out a Siemens star or a USAF chart as a test chart. I have made a combination of both. This has the advantage that I can use both methods at the same time and compare the values. The overall size (the outer frame) is exactly 400 mm x 300 mm. This is the optimum size for Minox shots from a distance of 600 to 1000 mm. I printed out the individual charts and then glued them together:
Photographing the Test Chart
There are a few things you should bear in mind before taking photos:
- Lighting: Use consistent, even lighting to avoid shadows or hot spots that could distort the image. Avoid direct sunlight as it can create harsh shadows and uneven exposure.
- Focus: Ensure the test chart is in sharp focus. Use manual focus for precise control. Consider using a tripod to prevent camera shake.
- Aperture: Take photos with different apertures to see how they affect image sharpness and depth of field.
- Distance: Maintain a consistent distance between the camera and the test chart for accurate comparisons. Use a scale or measuring tape to ensure precise distances.
A distance of 50 x focal length in mm is often recommended because the lenses supposedly show their best performance there. I have a different criterion for home use. Because I print the test charts myself with only 600 dpi, the center of the Siemens star and the very small elements of the USAF charts are not good enough for good lenses at close distances. But that is not a problem at all. I then increase the distance so far that the lens can only manage the larger rays and elements and thus get exact evaluations. - Orientation: Keep the test chart perpendicular to the camera sensor to avoid distortion.
- Camera Settings:
Analogue: Use a fine grain film.
Digital: Use a high-resolution setting (ISO 100) to capture as much detail as possible. Shoot in RAW format for maximum flexibility in post-processing.
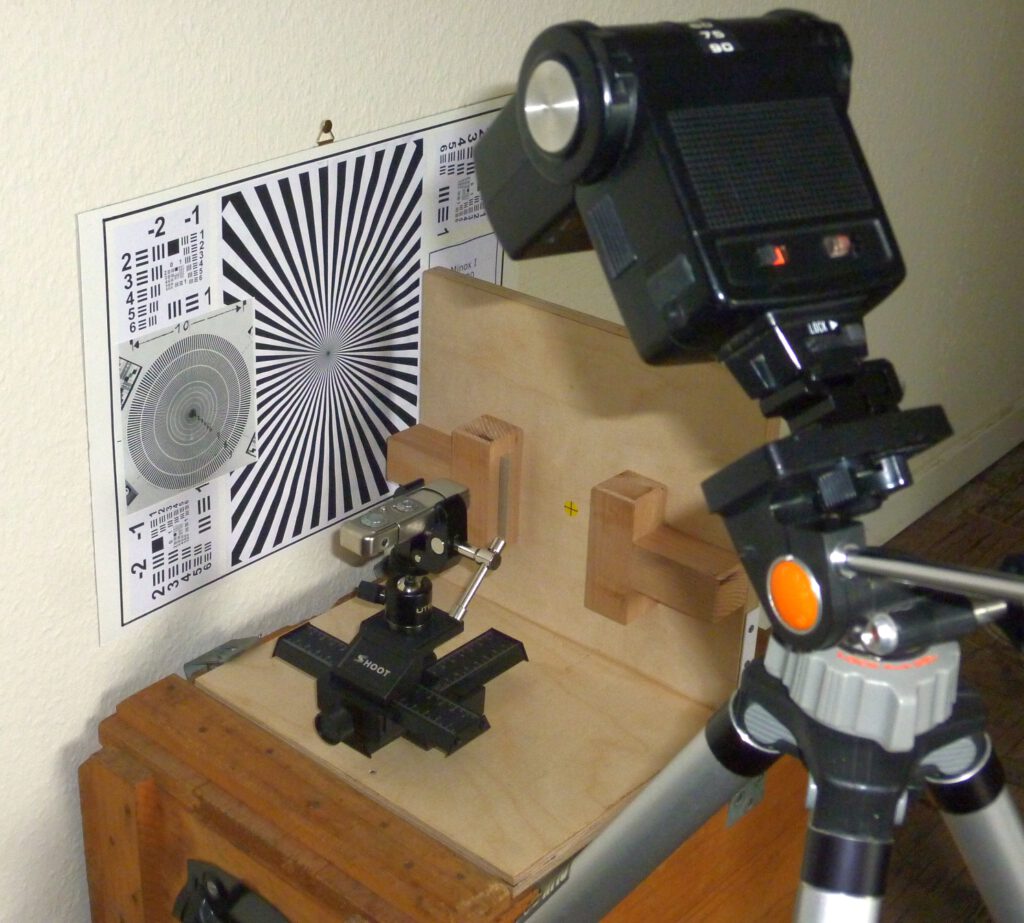
Special cameras: Some cameras have special setup requirements. The Riga Minox (see picture on the right), for example, does not have a cable release. Therefore, the camera must be exposed in darkness with the shutter open “B” using a manually triggered flash. It also has no tripod socket, so a special claw mount is required.
Evaluate the test photos
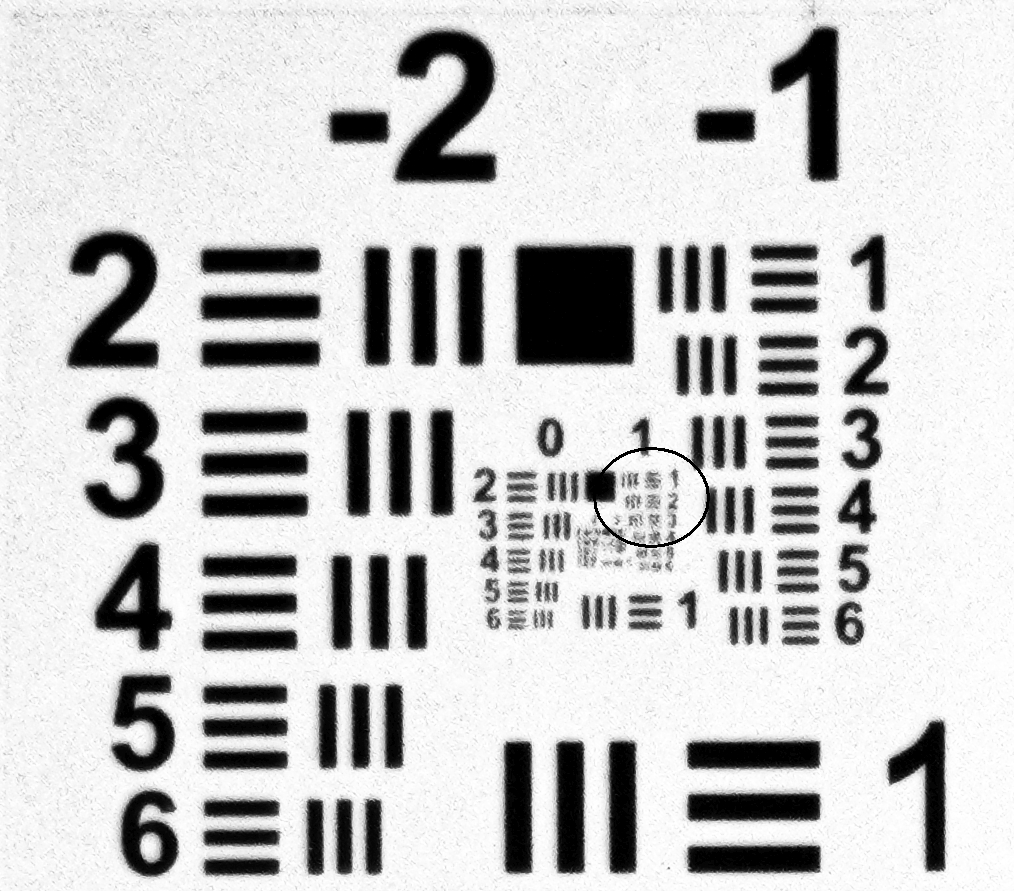
The following example was photographed with a Sony alpha 6000 using the 30 mm macro lens. Because of the expected good resolution, I chose a distance of almost 7 m, because otherwise the quality of my self-made test chart would not have been sufficient. The advantage of my method is that you can still achieve accurate results. This is (the relevant image section) from the photo taken:
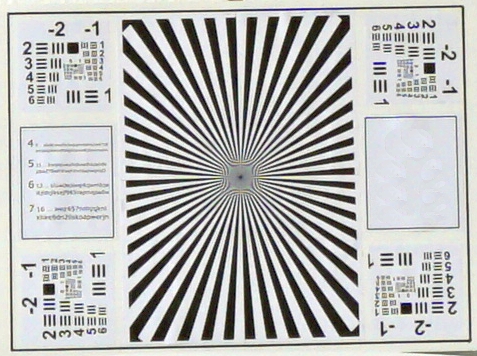
The resolution in the center of the image is determined by the diameter of the blurred, no longer resolved center of the Siemens star:
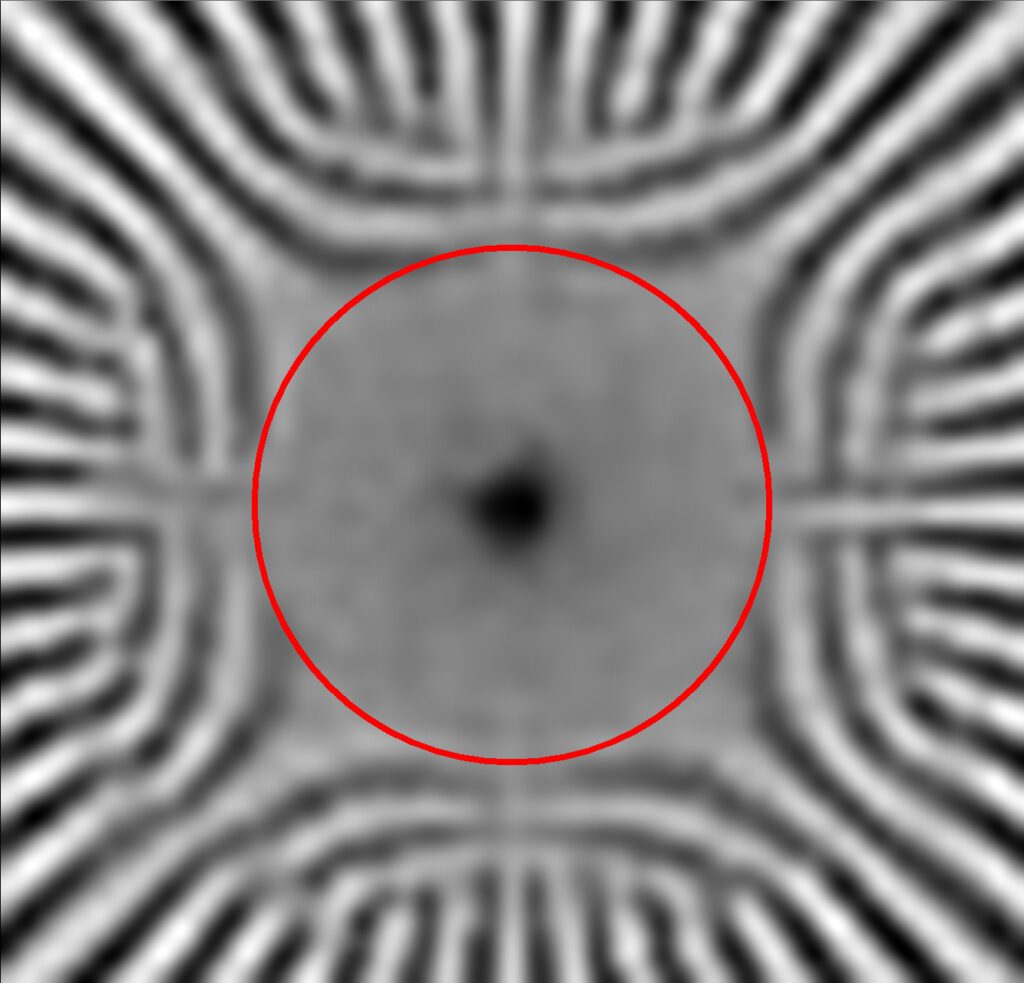
To get the size of the diameter, I crop exactly to the circle in the image processing software. Then I check how large the cropped area is in pixels. In our example, it is 23 pixels. With a camera pixel size of 0.039 mm and a Siemens star with 48 rays, this results in a resolution of 170 line pairs per mm (compare with the formula above in the explanation of the Siemens star).
Now we can also evaluate the USAF chart for control purposes. On all four charts, I recognize element 5 in group -1 as the smallest recognizable element. According to our formula or the table above, this results in a resolution of 0.794 line pairs per mm in object size.
For the final result, however, we still have to multiply this value by the reduction to the sensor size. The reduction is calculated from the actual frame width (400 mm) of the test chart compared to the frame width of the chart on the sensor. I calculate this by measuring the frame width on the photo in pixels with the image processing software and multiplying it by the pixel size in mm. In our example, I arrive at a reduction factor of 223 from the original chart to the imaged chart.
This results in a resolution of
223 x 0.794 LP/mm = 177 LP/mm
This value fits very well with the value we determined with the Siemens star.
What does resolution tell us?
As long as the size of the photo on the negative or sensor is the same, the resolution in lines per mm can be compared directly. But what happens if the size of the negative or sensor is different?
The lines per mm concept
Then the LP/mm value does say something about the quality of the lens/film or lens/sensor combination only. But often you want to conclude from the resolution how much you can enlarge the photo. Let’s take a look at an example.
Examples
Let’s assume that a test photo taken with a Minox and a digital APS-C camera have the same resolution value of 100 LP/mm. This is how it appears on the negative or sensor:
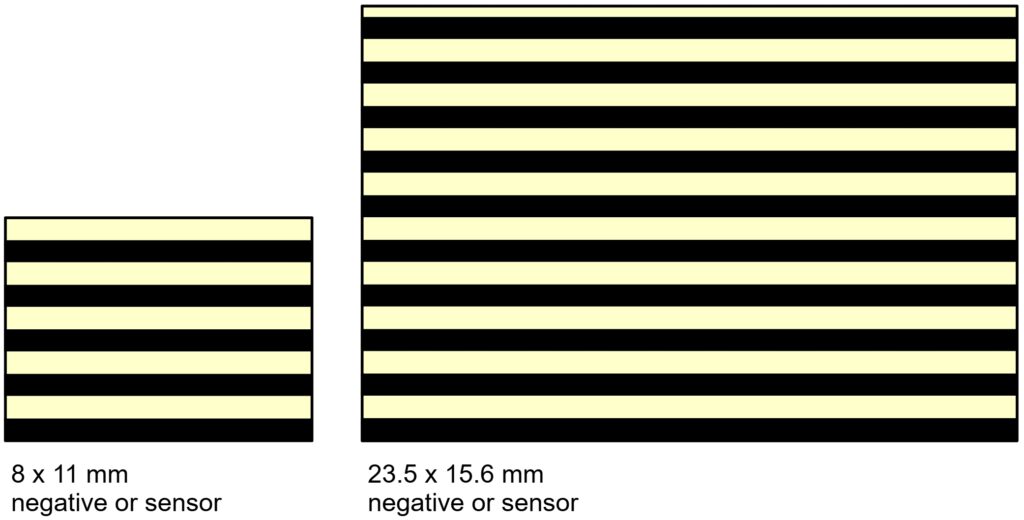
You can easily see that the photo on the right can be enlarged more because the same information has been captured with a larger number of pixels. In order to obtain a measure of the magnification potential, the number of lines per sensor or negative height is therefore calculated.
For the Minox negative on the left you get
8 mm x 100 LP/mm = 800 line pairs per height = 1600 LPH (lines per height)
For the APS-C sensor, the result is
15.6 mm x 100 LP/mm = 1560 line pairs per height = 3120 LPH
Now back to our initial question. How much can I enlarge the Minox negative without the resolution becoming visible? If we assume that we can resolve 5 line pairs per mm or 10 lines per mm with the naked eye at normal viewing distance (see USAF explanations above), the image height may be enlarged to
1600 LPH / 10 L/mm = 160 mm
The maximum image size would then be 160 mm high and 220 mm wide.
With the APS-C camera, the calculation looks like this. DOrt the image height may be enlarged to
3120 LPH / 10 L/mm = 312 mm
The maximum image size would then be 312 mm high and 470 mm wide.
In both cases, of course, we assume an ideal image medium, i.e. no grain on the enlarging paper and infinite pixel resolution when viewed on the screen.
With this method you can easily calculate the maximum magnification at any other viewing distance:
View the USAF chart (the original on paper) from the desired distance (for example 2 m). Identify the smallest element that you can still recognize (for example, element 6 from group -1). This results in a resolution of your eyes of 0.9 LP/mm (instead of 5 LP/mm at 400 mm). The magnification of the photo can therefore be 5.5 times greater than at reading distance).
Automatic evaluation with spreadsheet
To make the recurring calculations more convenient and error-free, I have developed a spreadsheet. With just a few entries you get the resolutions according to Siemens star and USAF. In addition, other values such as lines per picture height, magnification potential and Nyquist limit are calculated.
You can find the Excel file here. Once you have entered the camera data, you can enter the values highlighted in yellow for a test photo and obtain the corresponding resolutions:

Conclusion on testing lenses at home
To judge the resolution of cameras quantitatively and not just by feeling, we have to measure it. Testing lenses is possible with simple means. The evaluation can also be carried out with just a few calculations.
To compare cameras with the same negative size or sensor size, we can use the resolution in LP/mm. For different sizes, we need to compare the LPH.
But always remember what Henri Cartier-Bresson once said with a twinkle in his eye: “Sharpness is a bourgeois concept”!



Sehr beeindruckend. Ich werde sicher noch einige Male wiederkommen um mir die anderen Inhalte auch anzuschauen.
PS: Kontaktlinsen ? hier hat wahrscheinlich die Autokorrektur zugeschlagen… (in der Übersicht und in der Kapitelüberschrift.)
Danke!
Ja, die Übersetzung aus dem englischen Text erfolgt dynamisch bei jedem Aufruf der Seite. Deshalb kann ich die Wortwahl nicht beeinflussen. Manchmal kommen lustige Ergebnisse zustande…